

A look at the price of gold, starting from when we have traces of it up to the present day. Let’s then derive the income it has had over time by processing the variations in its price.
Disclaimer:
The information provided does not constitute a solicitation for the placement of personal savings. The use of the data and information contained as support for personal investment operations is at the complete risk of the reader.
#1. Gold price over time
I was able to recover the history of the price of gold starting from the year 1792. The price remained almost constant until 1933 and then almost doubled until 1970, the year in which the gold standard was first temporarily suspended and then fell into disuse.
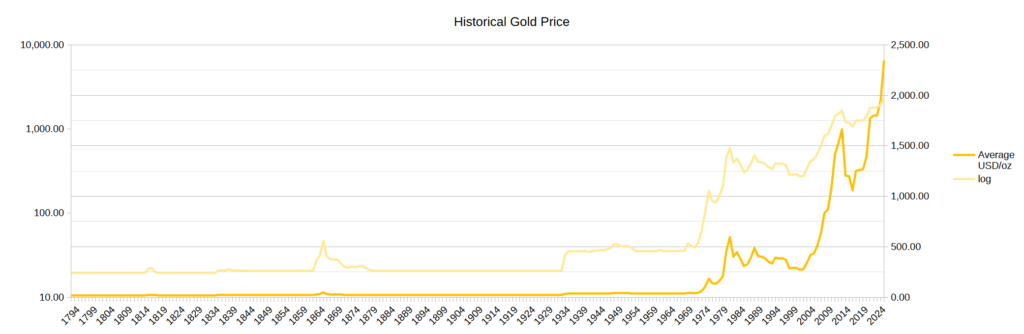
Gold maintained a fairly stable price over time of $20 per ounce until 1933, when Roosevelt, with Executive Order 6102, in the United States of America, ordered its delivery (in exchange for dollars) to the competent authorities. Each person was allowed to own no more than 5 ounces of gold (equal to about 150g). At that time, gold gained 75% reaching a value of $35.
Approaching 1971, the date in which Nixon will abandon the Gold Exchange Standard, the price of gold begins to rise and then explodes, with a brief pause of 2 years, in the decade from 1970 to 1980 reaching annual peaks of +120% and reaching an average annual price of around $600.
In the following years, gold will lose more than half of the maximum reached, retracing to $300, but without ever returning to the levels before the rise. For about 30 years, the peaks reached in 1980 will not be touched.
From the end of the first decade of the 21st century, around 2010, gold resumes its run even if it loses almost 30% between 2012 and 2020.
In 2024, at the date of this article, the value of gold is around $2700 per ounce. As a geopolitical scenario we have: Ukraine, Middle East, de-dollarization, increasingly high public debts and BRICS+.
#2. Gold performance over time
Since gold does not produce coupon or dividend income, the only way to calculate its yield is to compare its price at different points in time in order to develop an annuity model based on different time horizons and intervals.
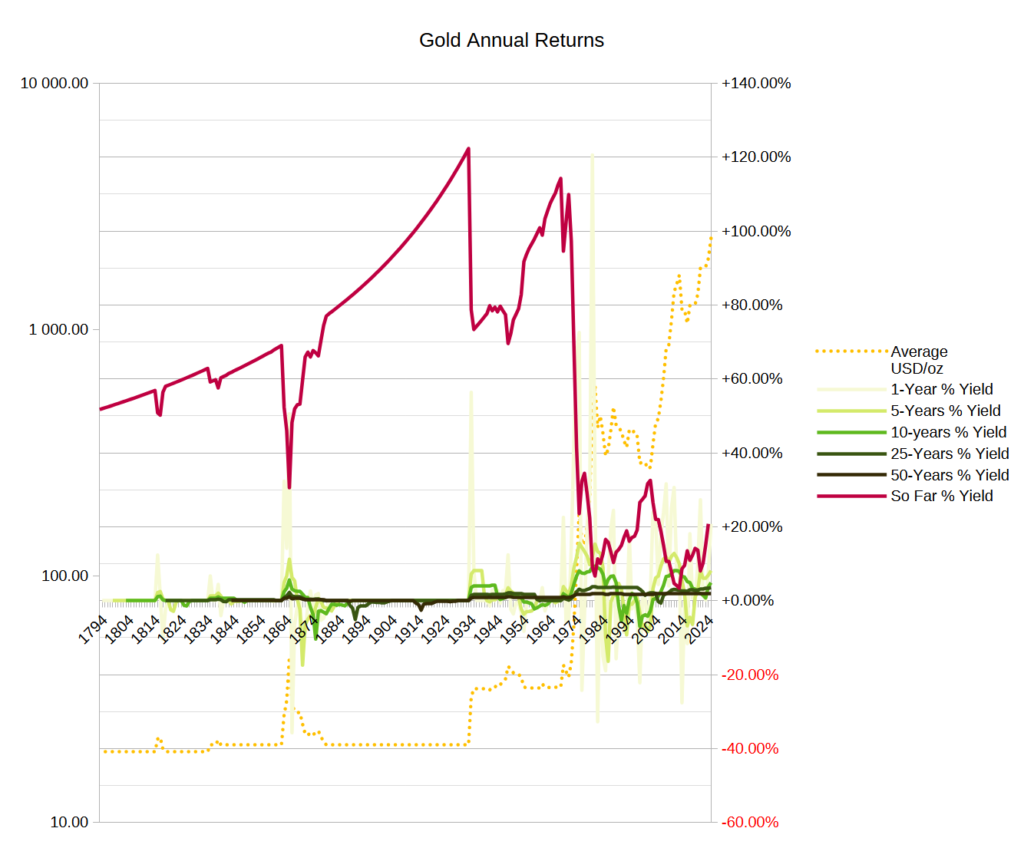
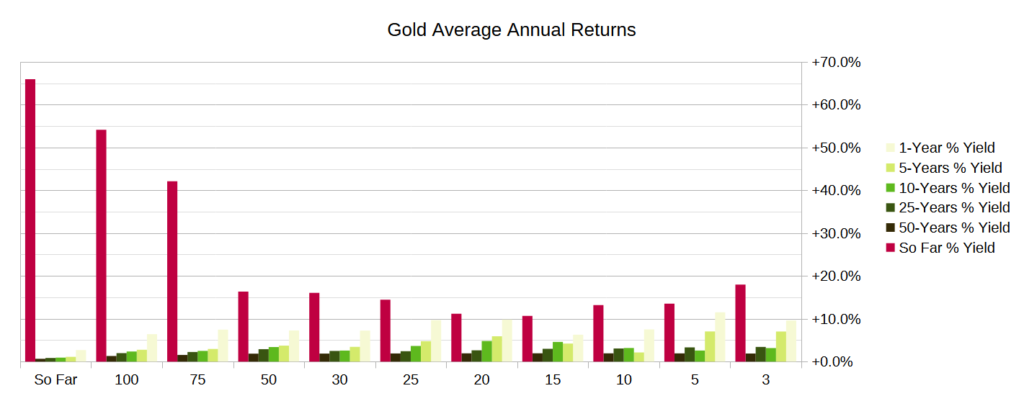
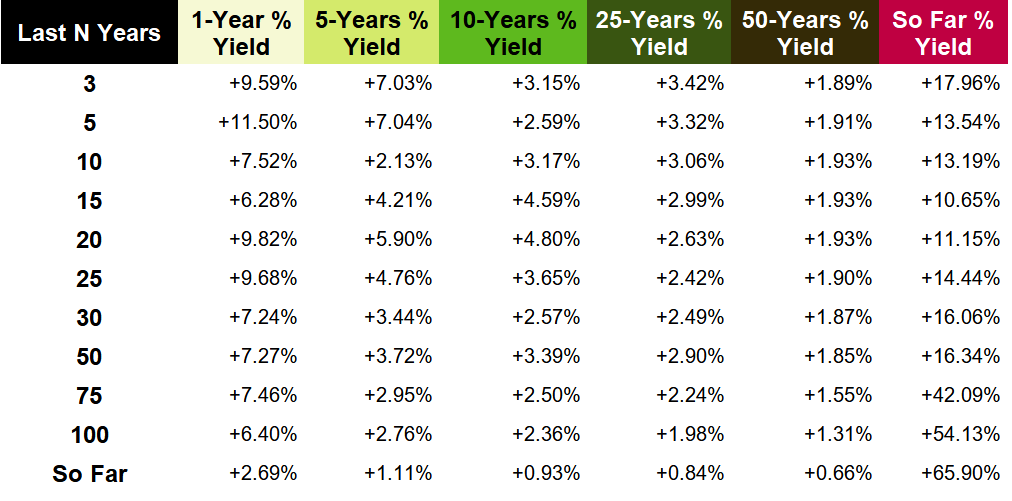
The return that gold gives over time is uneven and highly volatile, but over the last 50 years a solid base of 3% per year can be estimated for time horizons ranging from 1 to 25 years.
At the moment it seems to be within a bull cycle, which brings short-term annual returns up, touching values between 13-18%.
Sources and data:


Lascia un commento